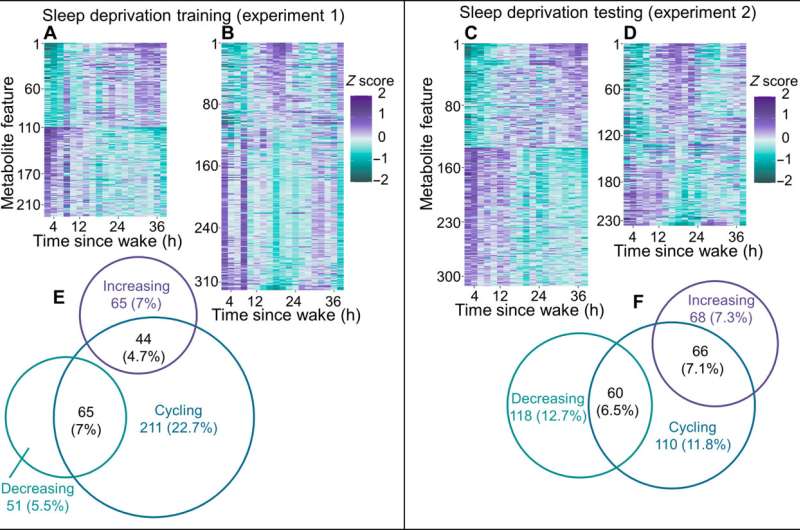
This article has been reviewed according to Science X's editorial process and policies. Features isolated by HILIC LC-MS and showing linear and/or cyclical trends during sleep deprivation. For all heatmaps, purple corresponds to the highest and green correspond to the lowest values for z-scored peak area. The Venn diagrams display the number and overlap of cycling, increasing or decreasing features.
#SCIENCE #English #SE
Read more at Medical Xpress